
4 Library overview
4.1 Summary
library(rd3c3)is a collection of wrapper functions- these wrapper functions are included within template to produce item analysis reports
- the item analysis reports provide different statistical and psychometric results of interest to make judgments regarding the quality of scale scores
4.2 rd3c3 as a collection of wrappers
The library(rd3c3) is a collection of wrapper functions (Stanton, 2017) that helps to streamline the task of genereting code to fit different measurement model specifications. Wrapper functions are a way to call more complex functions and code into a simpler user interface. The main aim of the library is to ease the coding time needed when assessing measurement invariance of polytomous batteries of items from background questionnaires of large scale assessment studies. The different model specifications follow Wu & Estabrook (2014), Svetina, Rutkowski & Rutkowski (2020) and Tse, Lai & Chang (2024) recommendations to fit different multigroup models of the graded response model with probit link, to fit strict, scalar, common threshold and base (i.e., descriptive) multigroup models. Moreover, the library also contains functions to apply alignment methods onto the same measurement model among groups. It relies on MplusAutomation (Hallquist & Wiley, 2018), to fit measurement models using Mplus (Muthén & Muthén, 2017), so all fitted models can take into account sample design features of large-scale assessment studies such as stratification variables, clustering variables, and survey weights (e.g., Stapleton, 2013).
The handler name of the library is rd3c3. This handler stems from the research development call number 3 (rd3), focused on cross cultural comparison (c3).
4.3 Code applicable to a set of items
Most of the wrapper functions included in library(rd3c3) are not intended to be use onto sole objects, such as vectors or data frames. These are design to be fitted onto a set of elements, define in a table. Once the table, which we call generally scale_info, is filled-in and is called into the R session, the wrapper functions can resolve which items are subject to an analysis, within a define data object a particular data frame. We illustrate the general logic of the wrapper functions with the following diagram.
For the wrapper functions to work, one needs to provide:
- a
scale_infotable - to specify within the table the
data_filename with the responses of interest - choose a particular scale, via a
scale_id
As such, the library contains different wrapper functions that have the same arguments. These arguments usually present the following form:
rd3c3::name_of_the_function(
  data = data_responses,
  scale_num = scale_id,
  scale_info = scales_data
)
This is the case for different functions within rd3c3. For example, to name a few:
rd3c3::get_descriptives()- is a wrapper function to produce nominal descriptives of items
rd3c3::missing_summary()- it generates a summary of missing data across items, distinguishing complete, partial and missing response patterns by observations
rd3c3::fit_grm2()- is a wrapper function that fits a graded response model with probit link onto a set of items declared in the
scale_infotable
- is a wrapper function that fits a graded response model with probit link onto a set of items declared in the
rd3c3::ctt_table()- it produces classical test theory statistics such as biserial correlations and alpha if deleted for set of items declared in the
scale_infotable
- it produces classical test theory statistics such as biserial correlations and alpha if deleted for set of items declared in the
For example, the rd3c3::get_descriptives() function generates item descriptives including means, standard deviations, and histograms; and instead of being applicable to a matrix of responses is applied onto a whole data object. Thanks to the additional arguments included in the wrapper function, the code is able to select the items that are indexed with a scale_id number within the scale_info table. Thus, just by specifing the desired scale_id the user can get the results for these collection of items contained in a particular data file.
Code
#------------------------------------------------------------------------------
# descriptives
#------------------------------------------------------------------------------

# -----------------------------------------------
# scale id
# -----------------------------------------------

rd3c3::silent(library(dplyr))

# -----------------------------------------------
# scale id
# -----------------------------------------------

scale_id <- 1

# -----------------------------------------------
# scales info
# -----------------------------------------------

scales_data <- readxl::read_xlsx(
               'guideline_scale_info_example.xlsx',
               sheet = 'scales_data'
               )

# -----------------------------------------------
# data file
# -----------------------------------------------

data_file <- scales_data %>%
dplyr::filter(scale_num == scale_id) %>%
dplyr::select(data_file) %>%
unique() %>%
dplyr::pull()

# -----------------------------------------------
# response matrix
# -----------------------------------------------

data_responses <- readRDS(data_file)

# -----------------------------------------------
# descriptives
# -----------------------------------------------

rd3c3::get_descriptives(
  data = data_responses,
  scale_num = scale_id,
  scale_info = scales_data) %>%
dplyr::select(var, missing, complete, n, mean, sd, skew, kurt, hist) %>%
knitr::kable(.,
  digits = 2,
caption = 'Table 1: descriptives example')| var | missing | complete | n | mean | sd | skew | kurt | hist |
|---|---|---|---|---|---|---|---|---|
| BSBG13A | 0.04 | 0.96 | 7480 | 2.13 | 0.84 | 0.61 | 2.97 | ▃▁▇▁▁▂▁▁ |
| BSBG13B | 0.04 | 0.96 | 7480 | 1.82 | 0.77 | 0.78 | 3.34 | ▆▁▇▁▁▂▁▁ |
| BSBG13C | 0.05 | 0.95 | 7480 | 1.84 | 0.83 | 0.83 | 3.16 | ▇▁▇▁▁▂▁▁ |
| BSBG13E | 0.04 | 0.96 | 7480 | 1.88 | 0.85 | 0.81 | 3.12 | ▇▁▇▁▁▂▁▁ |
The generated results are the descriptives of items BSBG13A, BSBG13B, BSBG13C, BSBG13E from the “Sense of School Belonging” scale, present in TIMSS 2019, for Chile and England.
4.4 Template based workflow
The library(rd3c3) is intended to produce item analys reports of polytomous scales, in the spirit of dynamic reports (Xie, 2017). These are reproducible statistical analysis, that fills-in a define template. For any scale_id, a collection of items, one can generate an item analys report that include different sets of results.
This is in stark contrast to a manually coded workflow, where the user needs to code every function to a set of specific items within a data frame, many times to build a single item analysis report to every scale. In comparison, a template based workflow already contains an opinionated set of analysis (Parker, 2017) selected with a purpose. In this case, to make judgments of the quality of scale scores in terms of unidimensionality, reliability, comparability and inference limitations. The following diagram depicts the contrast between these two manners to reach the set of intended item analysis reports.
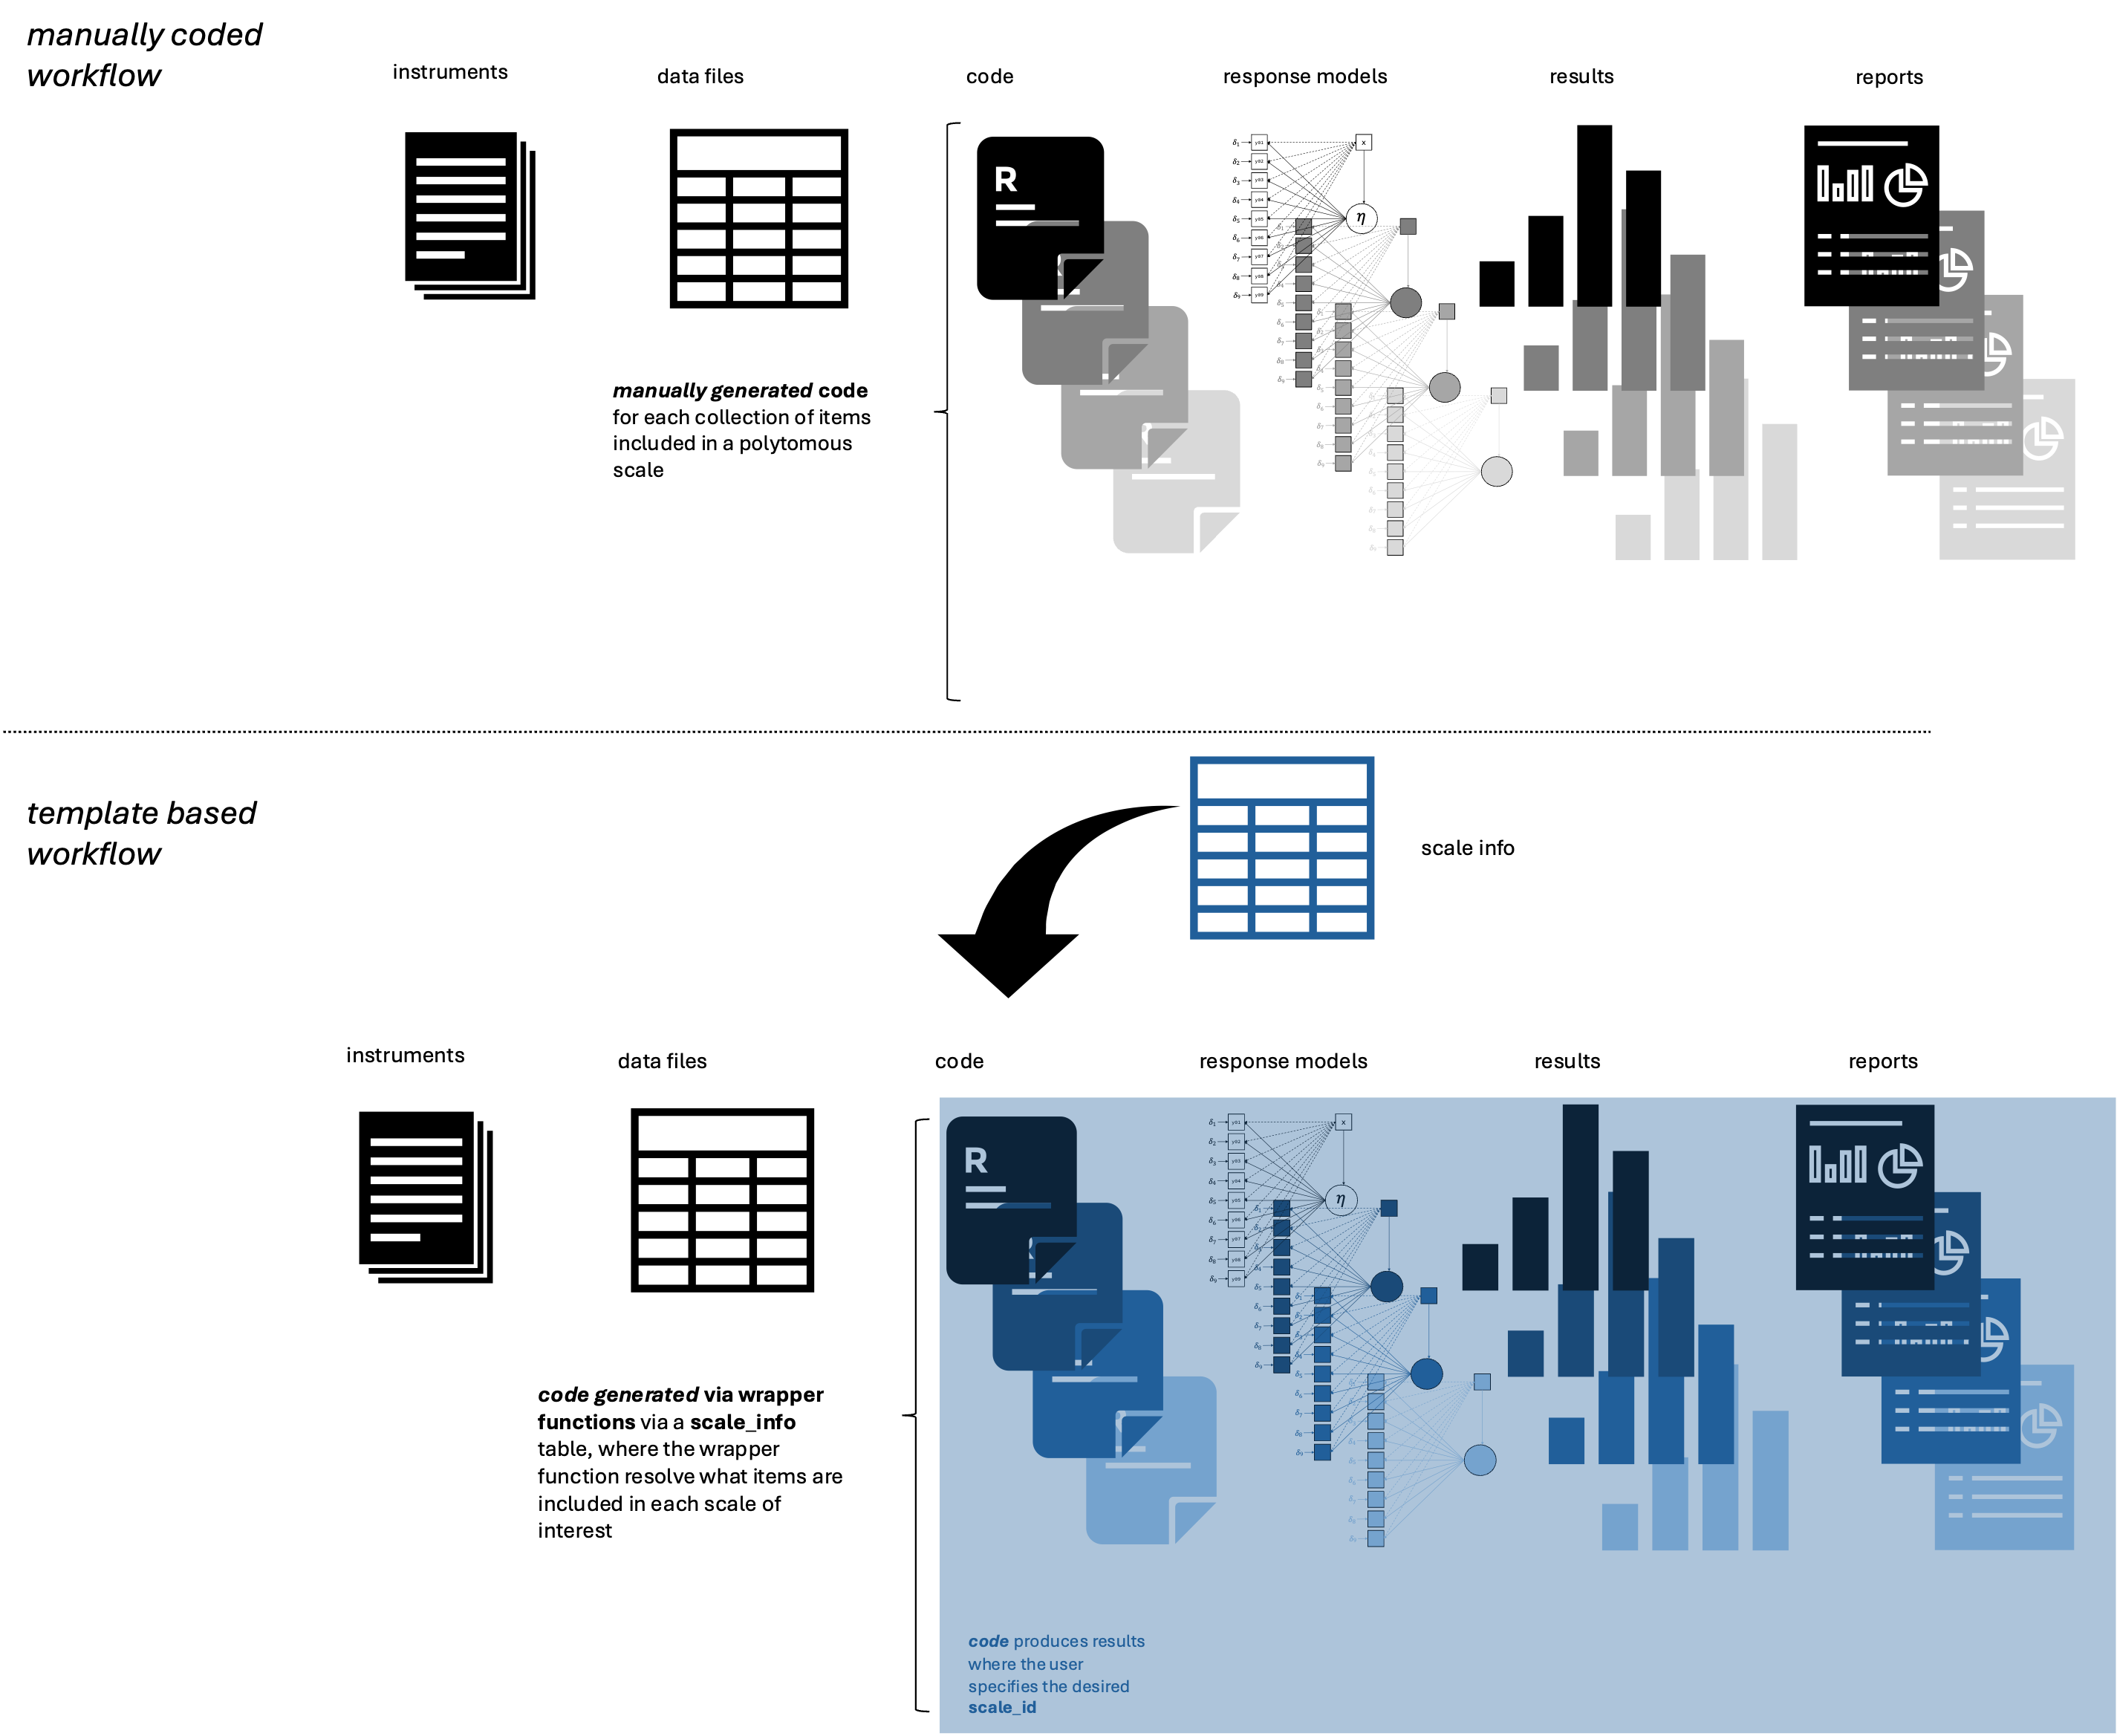
In the manually coded workflow the user needs to code each set of analysis for each set of items. While in the second workflow, the template based workflow, the user just needs to choose the respective scale_id and can get the intended item analys reports that should be already planned.
The logic of a template is that allows a user to get a series of results regarding the responses to a collection of items that are intended to measure a known attribute (i.e., a construct). This templates includes a selection of the different results a researcher can use to make judgements regarding the quality of a total score from polytomous items scale.
A template for assessing the quality of scale scores should follow different design data analysis principles such as reproducibility and exhaustivity (McGowan et al., 2023). This template should be reproducible in the sense that other user, with the same data file, library, and needed software (i.e., Mplus), should reach the same results. Thus, such a template should be able to get the same results present in a generated report. Ideally a template for item analysis reports should follows the design principle of exhaustivity, in the sense of including different results that helps to make a judgment regarding the quality of the scale score one can produce with the responses to a set of indicators. Using library(rd3c3) the users can include results from a graded response models, under different model specifications (i.e., strict, scalar, configural, base), and alignment methods for graded response models.
In essence, to build a dynamic item analysis report, the user needs to define the scale_info, define the data_responses of interest, and by using library(rd3c3) within a define template the user can include all the statistical analysis relevant for its purpose. As a whole, the user can generate dynamic results reports per scale. The following diagram summarize the minimal elements to produce these dynamic reports.

4.5 Main pieces of evidence to judge the quality of scales scores
The main pieces of evidence that librar(rd3c3) can produce for item analysis reports are:
- Unidimensionality
- Reliability
- Comparability
- Inference limitations
Unidimensionality is judge based on parallel analysis for ordinal indicators (Lubbe, 2019).
Reliability of scale scores is judge by inspecting the distribution of errors of the latent factor of the GRM model, its summary via person separation reliability (Verhavert et al., 2018) and via the Cronbach’s alpha index (Cronbach, 1951).
Comparability among participating countries is assess via the results of the model based measurement invariance results (Wu & Estabrook, 2016; Svetina, Rutkowski & Rutkowski, 2020; Tse, Lai & Chang, 2024), and the complementary results from the alignment analysis (Muthén & Asparouhov, 2014).
Inference limitations can be made based on an holistic judgment of previous results, regarding to which locations of the latent continuum the scale score is more informative, via inspection of the person item map, and the distribution of standard errors of the theta realizations of the measurement model. For example if the distribution of item location is concentrated in one of the tails a researcher can identify possible ceiling or floor effects of the scale (e.g., Carrasco, Rutkowski, and Rutkowski, 2023). Moreover, the item analysis reports provides results of measurement invariance and alignment methods providing information regarding the tenability of assuming a common measurement model among the compared groups. Thus, the researcher can spot scales scores where the comparison among groups may not be guarantee and further research is needed. Further research could isolate points of support for comparisons, by iterating the decisions on item and group selections and exclusions.
In the following section (section 4), we illustrate the application of the library(rd3c3) to produce invariance analysis, and build an item analysis report with the described characteristics.
4.6 References
Carrasco, D., Rutkowski, D., & Rutkowski, L. (2023). The advantages of regional large-scale assessments: Evidence from the ERCE learning survey. International Journal of Educational Development, 102(May), 102867. https://doi.org/10.1016/j.ijedudev.2023.102867
Cronbach, L. J. (1951). Coefficient alpha and the internal structure of tests. Psychometrika, 16(3), 297–334. https://doi.org/10.1007/BF02310555
Hallquist, M. N., & Wiley, J. F. (2018). MplusAutomation: An R Package for Facilitating Large-Scale Latent Variable Analyses in Mplus. Structural Equation Modeling: A Multidisciplinary Journal, 25(4), 621–638. https://doi.org/10.1080/10705511.2017.1402334
Lubbe, D. (2019). Parallel analysis with categorical variables: Impact of category probability proportions on dimensionality assessment accuracy. Psychological Methods, 24(3), 339–351. https://doi.org/10.1037/met0000171
McGowan, L. D. A., Peng, R. D., & Hicks, S. C. (2023). Design principles for data analysis. Journal of Computational and Graphical Statistics, 32(2), 754-761.
Muthén, L. K., & Muthén, B. O. (2017). Mplus User’s Guide (8th ed.). Muthén & Muthén.
Parker, H. (2017). Opinionated analysis development (pp. 1–13). https://doi.org/10.7287/peerj.preprints.3210
Stanton, J. M. (2017). Reasoning with Data. An Introduction to Traditional and Bayesian Statistics Using R. Guilford Press.
Stapleton, L. M. (2013). Incorporating Sampling Weights into Single- and Multilevel Analyses. In L. Rutkowski, M. von Davier, & D. Rutkowski (Eds.), Handbook of International Large scale Assessment: background, technical issues, and methods of data analysis (pp. 363–388). Chapman and Hall/CRC.
Svetina, D., Rutkowski, L., & Rutkowski, D. (2020). Multiple-Group Invariance with Categorical Outcomes Using Updated Guidelines: An Illustration Using Mplus and the lavaan/semTools Packages. Structural Equation Modeling: A Multidisciplinary Journal, 27(1), 111–130. https://doi.org/10.1080/10705511.2019.1602776
Tse, W. W. Y., Lai, M. H. C., & Zhang, Y. (2024). Does strict invariance matter? Valid group mean comparisons with ordered-categorical items. Behavior Research Methods, 56(4), 3117–3139. https://doi.org/10.3758/s13428-023-02247-6
Verhavert, S., De Maeyer, S., Donche, V., & Coertjens, L. (2018). Scale separation reliability: What does it mean in the context of comparative judgment?. Applied Psychological Measurement, 42(6), 428-445.
Wu, H., & Estabrook, R. (2016). Identification of Confirmatory Factor Analysis Models of Different Levels of Invariance for Ordered Categorical Outcomes. Psychometrika, 81(4), 1014–1045. https://doi.org/10.1007/s11336-016-9506-0
Xie, Y. (2017). Dynamic Documents with R and knitr. CRC Press.